Dashboard
The admin panel dashboard showcases different figures, metrics, charts, and activities, with a refresh data option to retrieve the latest information at any time.
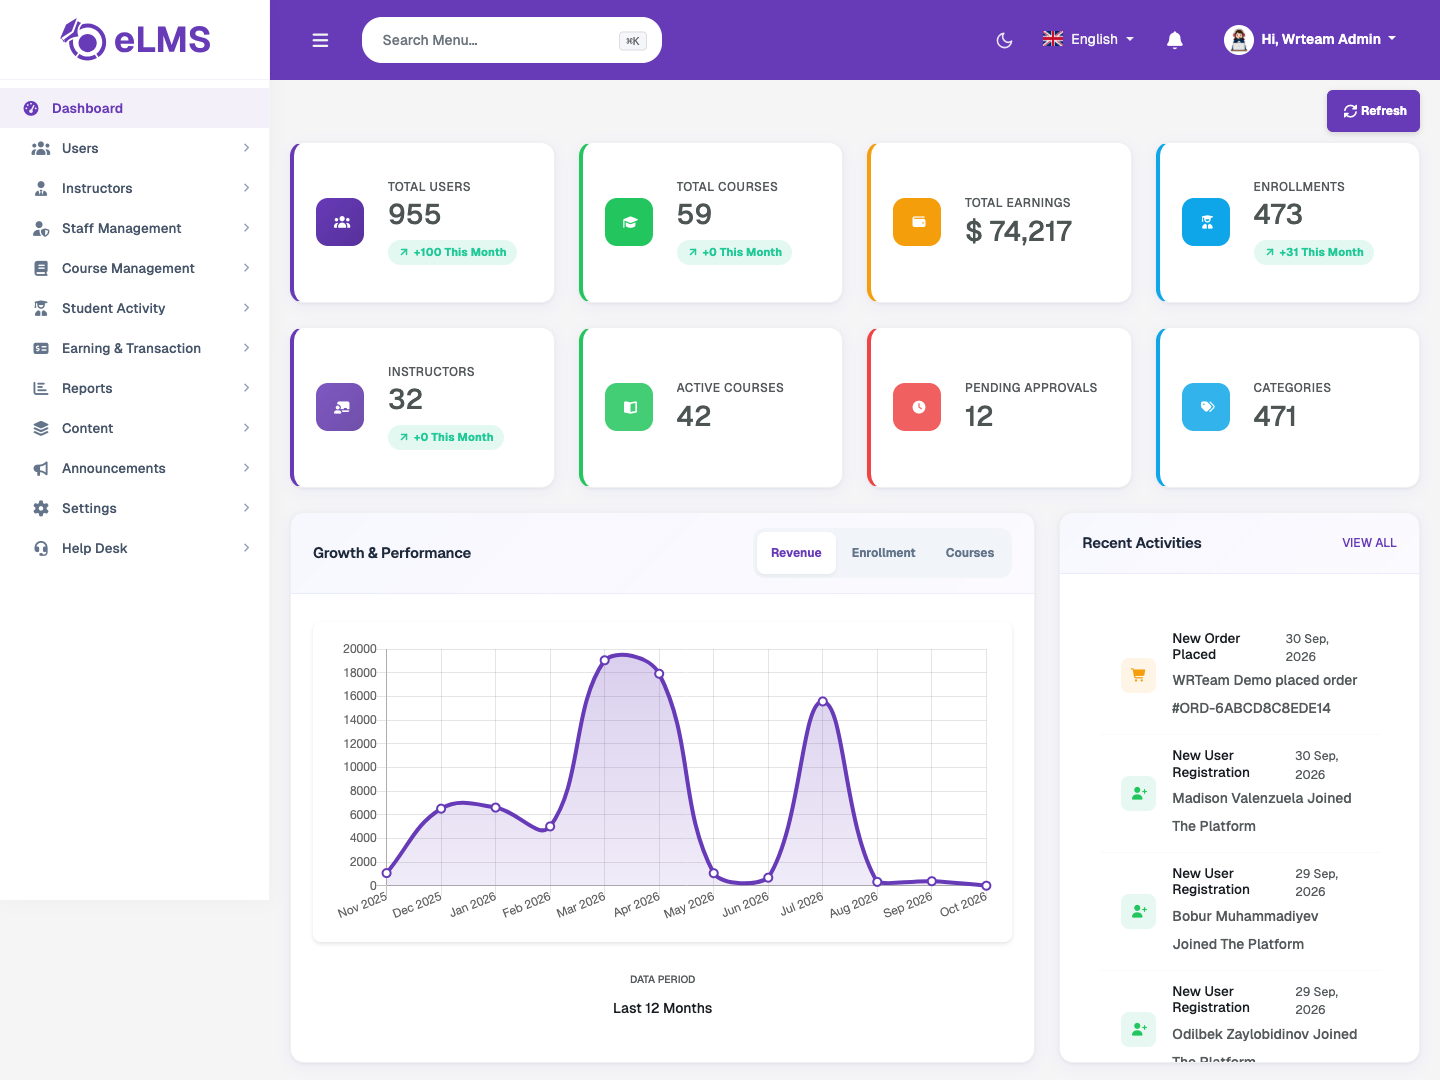
General Statistics
- Total Users – The total number of users registered on the platform.
- Total Courses – The total number of courses added on the platform.
- Total Earnings – Total revenue generated from course sales across the entire platform.
- Total Enrollments – The total number of user enrollments across all courses.
- Total Instructors – The total number of instructors registered on the platform.
- Active Courses – The number of courses that are approved and live for users to view.
- Courses Pending Approval – The number of courses that have not yet been approved or rejected.
- Total Categories – The total number of categories and sub-categories in which courses can be added.
Growth & Performance
A graph displaying monthly data from the past year through the present, with three filtering options: Revenue, Enrollment, and Courses.
Recent Activities
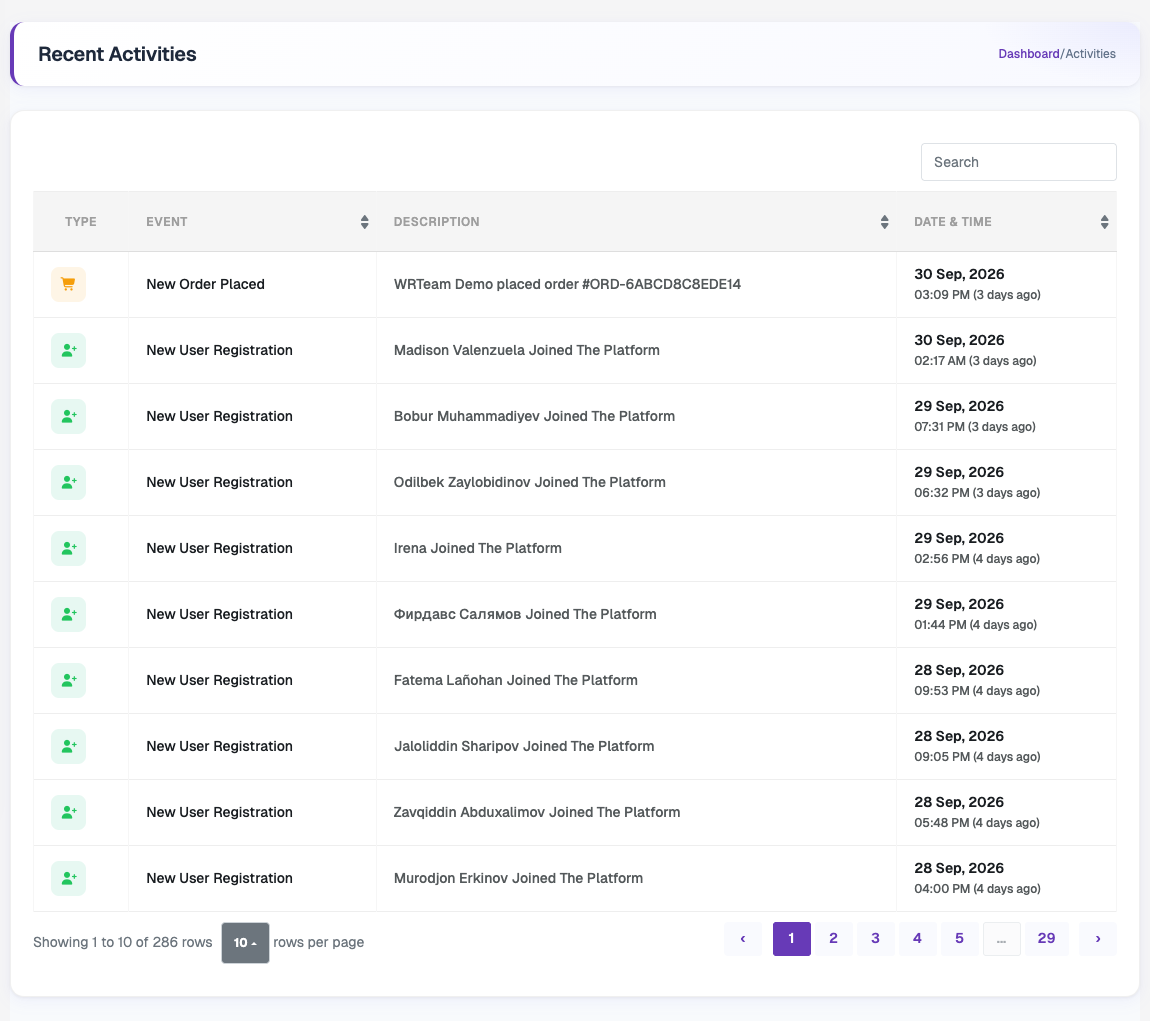
Displays a list of recent platform activities, including new user registrations, course creations, and orders placed, along with their timestamps. The View All button opens the full Recent Activities list, where you can search, sort and browse all activities with their type, event, description and date & time.
Ratings & Satisfaction
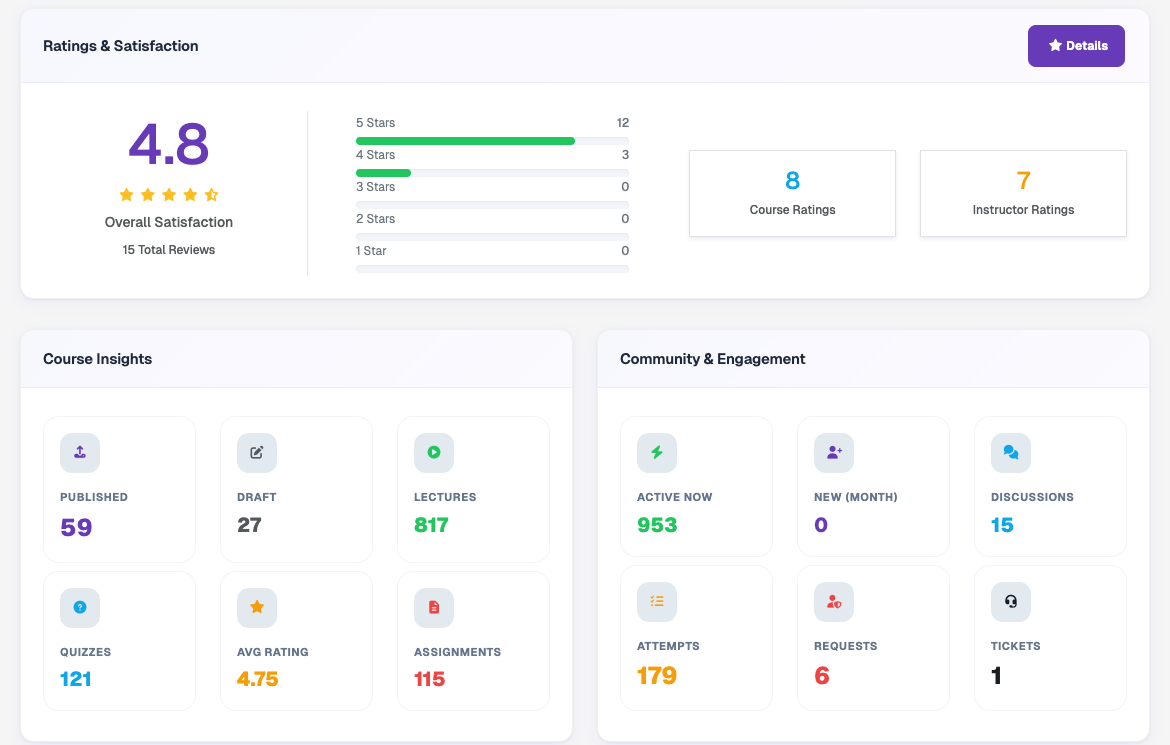
Displays the overall ratings for instructors and courses, including average ratings and star-wise rating totals. A Details button redirects to the Ratings Management page for a more in-depth view.
Course Insights
Displays the following values related to courses: Published Course Count, Draft Course Count, Total Lectures Count, Total Quizzes Count, Average Ratings on Courses, and Total Assignments Count.
Community & Engagement
Displays the following values related to user engagement: Active Users Count, Current Month New User Count, Discussions Count, Quiz Attempts Count, Pending Instructors Count, and Support Tickets Count.
Top Instructors
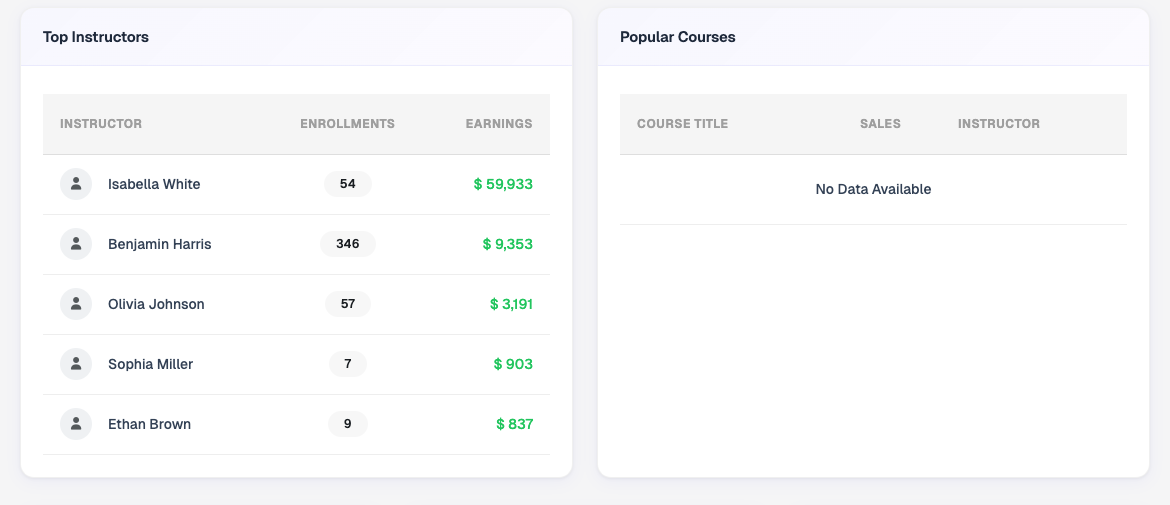
Displays the top 5 instructors who have generated the most revenue on the platform.
Popular Courses
Displays the top 5 courses with the highest enrollment count.
Net Revenue
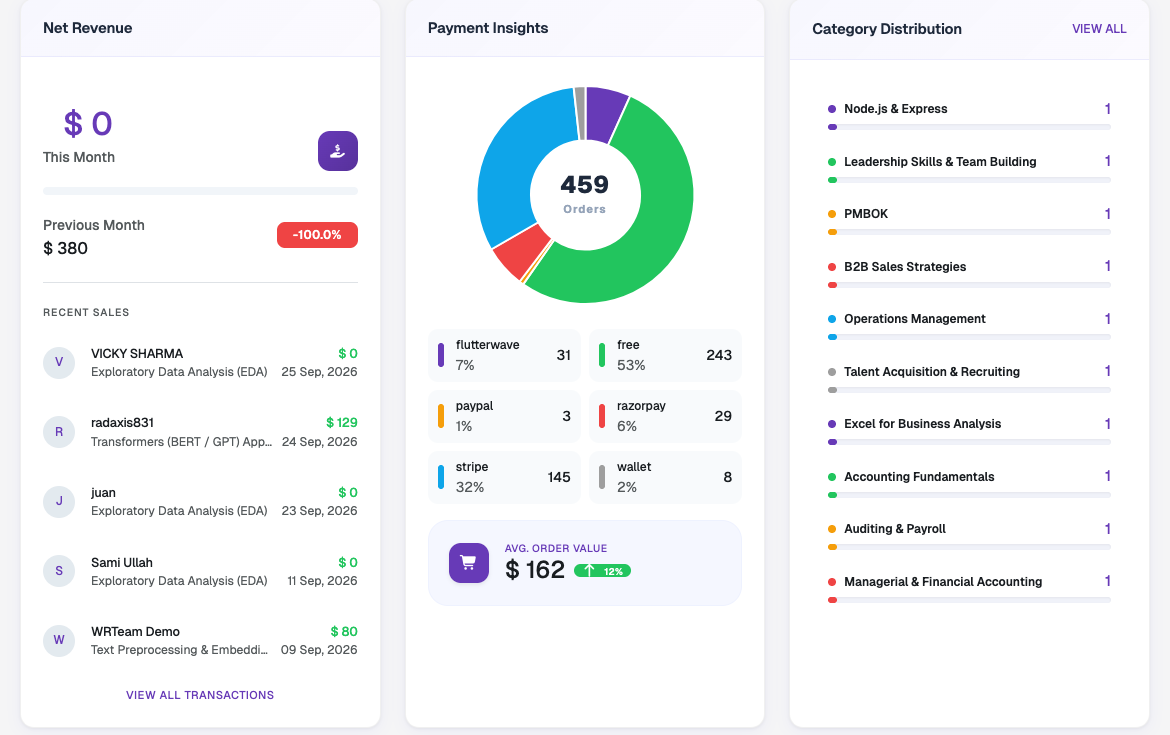
Displays the revenue for the current and the previous month along with the growth percentage.
Payment Insights
Displays the income flow from different payment methods — including revenue from orders placed via different payment gateways and wallets — along with the average order value.
Category Distribution
Displays the total number of courses in each category, listed from the most to the least populated.